The home screen
The home screen answers one question before you read a word: is anything wrong right now?
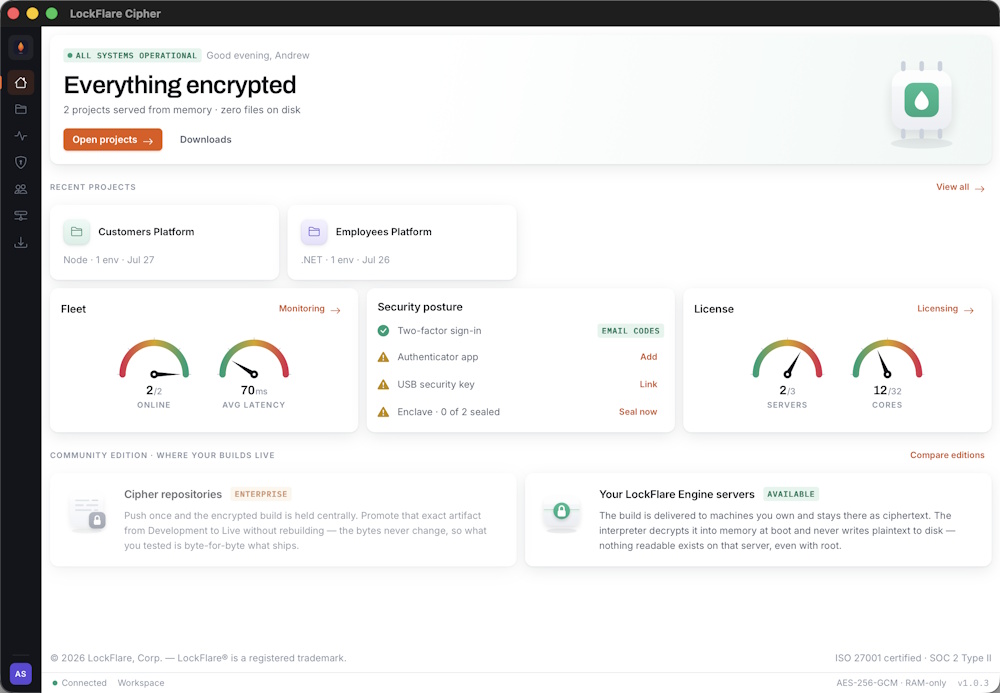
The header states the fleet’s condition and changes colour with it. Below: recent projects, then fleet, security posture and licence.
The header
The status chip and the headline are driven by live state, not by a greeting. Everything encrypted with a green wash means every server is serving. If servers are unreachable it says so, turns amber, and the primary action changes to take you to Monitoring.
The mark on the right follows the same state, so the screen reads as healthy or unhealthy from across the room.
Recent projects
The projects you touched most recently, with their runtime, environment count and last change. Click through to open one directly.
Fleet
Two gauges: servers online and average latency across the fleet. The online gauge runs backwards from the others — full is good, and it walks left into amber and red as servers drop.
Security posture
A checklist of the account’s security state: two-factor method, whether a USB key is linked, and how many servers are sealed. Anything unresolved shows an amber triangle and a link straight to the screen that fixes it.
Licence
Servers and cores as gauges against your plan. These run the usual direction: full is bad, because full means you cannot add another server without more capacity. At the ceiling the gauge turns red.
Where your builds live
Two cards at the bottom state which storage options this account has — the Cipher Encrypted CDN, and your own Engine servers. On the free tier the first is marked Enterprise and dimmed, which means the encrypted build lives on your server rather than centrally. It is AES-256-GCM encrypted in both cases. See Editions.